


New federal data released last week found life expectancy in Ohio is worse than 41 other states and is the lowest-ranked of the top 10 most populated U.S. states (Read more below: “Ohio’s life expectancy among the worst in U.S.,” Axios-Columbus, Feb 17).
The average life expectancy at birth in Ohio is 76.9, according to 2019 state-by-state data released by the CDC last week. That is down about a full year since 2010. Ohio joins neighbors Indiana, Kentucky and West Virginia in the low CDC rankings, along with most southeastern states.
The findings are consistent with those in HPIO’s 2021 Health Value Dashboard, which ranked Ohio 47th on health value, a composite measure of population health and health care spending. The Dashboard identified three key factors for Ohio’s low ranking: childhood adversity and trauma, systemic inequities and sparse spending on public health and prevention efforts.
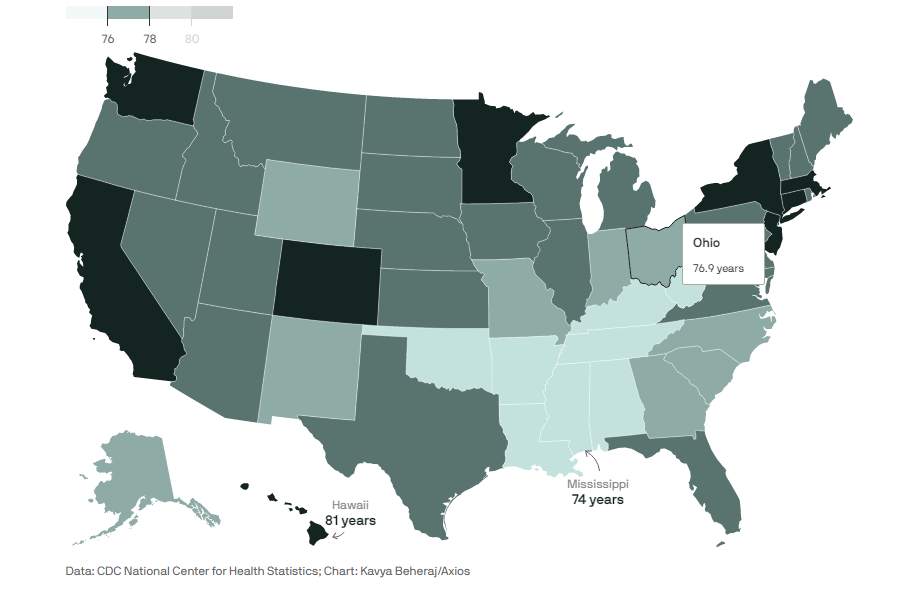
Estimated life expectancy at birth, 2019
The average life expectancy at birth in Ohio is 76.9, according to 2019 state-by-state data released by the CDC last week.
- That puts the Buckeye State at No. 42 nationally and makes us the worst-ranked of the top 10 most populated U.S. states.
Why it matters: Decreasing longevity points to underlying issues impacting Ohioans’ overall health and quality of life.
The big picture: Ohio joins neighbors Indiana, Kentucky and West Virginia in the low CDC rankings, along with most southeastern states.
- Our expectancy has declined by about a full year since 2010.
Zoom in: The Health Policy Institute of Ohio sounded the alarm last year with a report that ranked Ohio 47th on health value, a composite measure of population health and health care spending as of 2018.
- Three key negative factors included childhood adversity and trauma, systemic inequities, and sparse spending on public health and prevention efforts.
Threat level: Ohio also ranks high among risk factors tracked by the CDC, including obesity and cigarette usage.
Yes, but: Wide discrepancies in life expectancy exist among communities, with issues like poverty and racism playing a role.
- The institute noted a massive gap between residents of Franklinton, the census tract with the lowest life expectancy in Ohio (60), and Stow, a northeast Ohio suburb with the highest (89.2).
- And an Ohio woman’s life expectancy was 5.2 years higher than a man’s in 2019, mirroring the national trend.
What’s next: Unfortunately, the situation is probably going to get worse before it gets better.
- While the CDC report lists the most recent state-by-state data available, it’s from before the pandemic began.
Using national data that takes into account COVID-19, the CDC recently reported that the overall U.S. life expectancy fell to 77 years in 2020 from 78.8 years in 2019 —the largest one-year decline since World War II.
- COVID-19 emerged as the third-leading cause of death, after heart disease and cancer.
- People of color were disproportionately impacted.
Check out the full interactive map.
Sources: